Mike Schaeffer's Blog

Articles with tag: history
July 7, 2006

Kerry Nietz, author of FoxTales, dropped me a note regarding a comment I made about his book back in January. I thought it was worth repeating part of my response here:

"Like I said in January, the book brought back memories of the first few years of my career. Obviously the details are different, but if my kids ever ask about the beginning of my career I'll point them to your book first. You did an excellent job capturing the spirit of commercial software development."

I re-skimmed the book last night (setting aside a brand-new copy of C.J. Date's Database in Depth, ironically enough), and it still seems relevant, six months after the initial read. That's always a good sign.

January 5, 2006

I was roaming through the computer section of the University of Pennsylvania bookstore and ran across Pentium Chronicles, a 2006 book talking about experiences designing the P6 processor core used in the Pentium Pro, II, III, and Centrino. The author, Robert P. Collwell, was basically made employee number 1 on the P6 program when he was hired into Intel and given the assignment to "double the performance of the P5 on the same process." Of course, now, 15 years after that fateful assignment, it's pretty clear how influential the design produced by that program has been: it gave Intel a presence in the server and workstation markets, and it's still overshadowing its immediate sucessor, the Pentium4. Even if the project hadn't been that successful, the first 20% of Dr. Collwell's book has me convinved that it'd have been an interesting read anyway.

At the opposite end of the spectrum is Kerry Nietz's book, FoxTales. As much as Pentium Chronicles was the view from the top, the perspective of a very senior architect at Intel on a huge, industry-wide project, FoxTales is the opposite: the perspective of a fresh out of school programmer working on his first niche market shrink wrapped software package. If anything, that means it's much more likely to be relevant to people with the time to read this blog: it certainly brought back memories of the first years of my career.

The best thing about both of these books is that they are both cheap and short. You can probably read them both for <$50 and 10-20 hours of time, all of which would be well spent.

October 7, 2005

I suspected as much, but Excel has a way to duplicate my UDF using Excel formulas.

=REPT("&#9608;",A1) & REPT("&#9612;",ROUND(FLOOR(A1,1),0))

That formula evaluates to a bar of length A1 units, rounded to the nearest 0.5. Rescaling can be done in another cell. If you're interested in a bar that can be right-justified, you can use this:

=REPT("&#9616;",ROUND(A1-FLOOR(A1,1),0)) & REPT("&#9608;",A1)

The trickiest part about this is getting the block characters into the formula. For that, I reccomend using the Windows Character Map.

Qualitatively compared to VBA, this method requires more logic to be represented in the spreadsheet: that adds compelxity for readers and makes it tricker to set up than the VBA. On the other hand, it avoids the performance hit of calling UDF and the requirement that the spreadsheet contain a macro. I honestly don't know which is better style, but can say that this would be a perfect time to use a paramaterized range name (if Excel had such a thing).

October 7, 2005

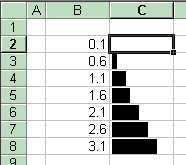
Microsoft has just announced a cool new feature on the Excel 12 blog: the databar. I think a picture (linked from Microsoft's Excel 12 Blog can explain it better than I can:

This will be a nice way to look for trends/outliers, but I can also see it being useful for tracking parallel completion percentages in status reports, etc. Of the Excel 12 features announced so far, this is the one that I'm the most excited about. Of course, it's also the one that's easiest to approximate in Excel <12. Andrew has an approach using Autoshapes on his blog, and I'm going to present a slightly different approach.

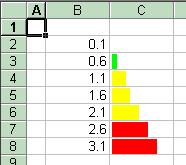
IMO, his approach looks a lot better, this approach has the benefit of updating automatically. Pick your poison. It all centers around this little UDF:

Option Explicit

Function GraphBar(x As Double, _
                  Low As Double, _
                  High As Double, _
                  ScaleTo As Double) As String

    x = ((x - Low) / (High - Low)) * ScaleTo
    
    Dim i As Integer
    
    Dim blockFull As String
    Dim blockHalf As String
    
    blockFull = ChrW(9608)
    blockHalf = ChrW(9612)
    
    GraphBar = ""
    
    For i = 1 To Fix(x)
        GraphBar = GraphBar + blockFull
    Next
    
    If x - Fix(x) > 0.5 Then
        GraphBar = GraphBar + blockHalf
    End If
End Function

This isn't rocket science: all it does is rescale x from the range [Low, High] to the range [0.0, ScaleTo]. Then, it strings together that many Chrw(9608)'s, followed by a Chrw(9612), if the scaled value's fractional part is >0.5. The trick in this is that Chrw(9608) and Chrw(9612) are VBA expressions that produce the the Unicode equivalent of the old line drawing characters IBM put in the original PC [1]. 9608 is a full box ("█"), 9612 is a half box on the left ("▌"). The result of this function ends up being a string that (when displayed as Arial) looks like a horizontal bar. ("████▌"). Put a few of those in adjacent cells, and you get this:

The formulat in C2 (and filled down) is =GraphBar(B2,MIN(B$2:B$8),MAX(B$2:B$8),5). The MIN and MAX set the scale, the 5 sets the maximum length of a bar. The maximum length, font size, column width can be tweaked to produce a reasonably attractive result, although I do reccomend using vertical centering.

If you want to get a little fancier, conditional formatting works on plot cells...

...whitespace can possibly improve the appearance...

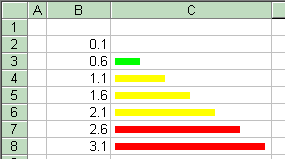
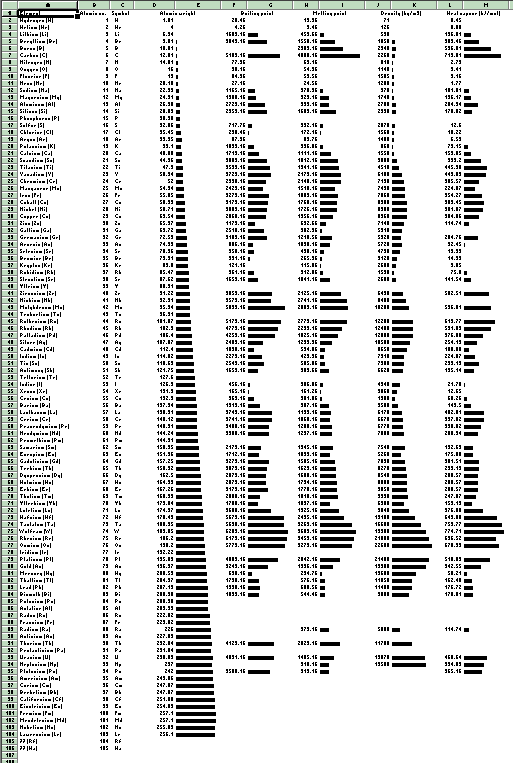
...and this technique can scale.

1] (The original PC didn't have standard graphics, it was an option. If you bought the monochrome, non-graphics, video board, characters like this were as close as you could get to a bar chart.)

Older Articles...